Tuesday, June 23, 2009

Transparent legend in your plots

Have you ever made a plot with several data series together and found that there is no way to put an explanatory legend onto the plot without hiding crucial data points? One answer to this problem can be to overlay a transparent legend. There are two routes to this "graphical goodness" that I would immediately think about:

  • Create an image file from your plot and then "photoshop" it (or gimp it...)
  • Add the alpha channel directly in the plotting tool...
Matlab can possibly do this, I really don't know. Here's how to do it in python. Say you have some data you want to plot, for example the sine and cosine function. Then you'd overlay a transparent key to your data. Let's dive in..

from pylab import * t = linspace(-2*pi,2*pi) y1=cos(t); y2=sin(t); plot(t,y1,label='Cosine') plot(t,y2,label='Sine') xlabel('Time') ylabel('y')
axis([-2*pi,2*pi,-1,1])
leg=legend()
savefig('namehere.png')
close()

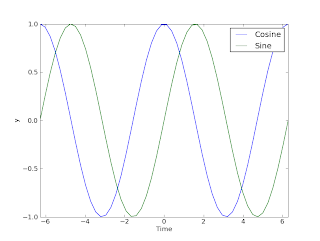
Now we see from the resulting plot that the legend covers some of the graph. Now, before the "savefig" command, add the following:
frame=leg.get_frame()
frame.set_alpha(0.4)


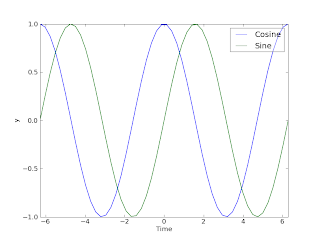
The resulting plot is shown below the original. Better, don't you think? :-)

PS! Click on the plots to show larger versions!

Monday, June 15, 2009

Coding is better with java ... the coffee, that is.

Ah... a non-tech, short post. This morning I started implementing some numerical experiments. Sitting in my favorite coffee shop drinking the best brew I know - that I call perfect conditions for coding. And, as always, Python is your friend (Java is a coffee type, not a programming language... ).

So what did I do in the coffee shop? I wrote a small reporting tool to compute total hours spent on different projects as registered in the timereg tool I described previously. The tool is very simple; I just read the timereg log into a Python list using the readlines command and exploit the structure. I make two lists; one for project names and one for hours spent. Each time a project name is encountered that I haven't seen before when iterating over the readlines list, I add it and also add the number of hours spent in the first instance of this project. Then, just keep adding for each project:

for k in readlineslist:
if k[0] in names:
for z in range(0,names):
if readlineslist[z]==k[0]:
timelist[z]+=k[-1]
....

Get the picture? Of course I write off everything to a text file for billing purposes.

Well, time to hit the road to the real office. Enjoy your day and happy pythoneering!

Saturday, June 13, 2009

Automate text processing with string methods

Have you ever had the need to reorganize a text file? Say you have some file that is organized in the following way:

Variable1
20
Variable2
30
....

Say you would like to reorganize that into something more spreadsheet-like, such as

Variable1 20
Variable2 30
---

Easy enough by hand in Excel or OOo calc if there are a couple of values. What if your list contains 20.000 entries? Then a script is your hero. Let's make a command line tool to reorganize such files using Python. We want the script to work like this on the command line:

>> reorganize inputfile.txt outputfile.txt

Therefore, we need to import the sys.argv list (containing command line arguments). Next, we need to use file methods to read the contents of file A into a list that we can operate on. The start of our script is thus:

#!/usr/bin/env python

from sys import argv as filenames

inputfile=open(str(filenames[1]),'r')
inputlist=inputfile.readlines()
inputfile.close()

Now we have a Python list like this:

inputlist=['Variable1\n','20\n','Variable2\n','30\n']

where the '\n' thing means line break. We cannot just write this directly to a new file, we need to strip the '\n' from list elements with even index numbers (indexing starting at zero) and we need to add '\t' to the same list elements to get a tab-separated file easily. An easy way to do this is the following; make two lists, one holding the "names" and one holding the "values". While making these lists, remove all line breaks using the replace method of string objects and replace them with tab characters ('\t'). The code:

ColA=[]; ColB=[];
for k in range(0,len(inputlist)/2):
ColA.append(inputlist[2*k].replace('\n','\t')
ColB.append(inputlist[2*k+1]

Then, simply write to the output file:

outputfile=open(filenames[2],'w')
for k in range(0,len(ColA)):
outputfile.write(ColA[k]+ColB[k])

outputfile.close()

Putting these commands together yields a script that gives you the desired result... (This is a tool I use every day - text processing is so much simpler for a scripter than for the average Excel user). Note that it is possible to do this directly in a spreadsheet using macros. I might consider writing the solution to that one day to. Or not.. :-)
Friday, June 5, 2009

regKPI: register a KPI value in a database or text file

Some days ago I wrote a post on a simple console program. One of the sub-routines in that program was a function called regKPI. We will now dwelve into this function a bit (see original post at A simple console program). If we have a system where we have several KPI's to record, the simplest way to deal with this is the ask the user for a KPI name. Then we know that the answer should be treated as a string. For this we use Python's raw input construct:

def regKPI():
KPIName = raw_input("What is the name of your KPI ?")
---

This way the user does not have to enclose her answer in string delimiters to make the program understand we are talking about character strings. The next question can be "what is the value of your KPI?", and we can take this as a string too. If we are only expecting numbers, we can use just input, and the numeric form is taken directly, but then it has to converted to a string afterwards if it is going to be written into an ASCII file (my favorite "mini" database).

To see how to write the data to a text file, wee the blog post "Writing time data to file". That pretty much sums it up for now. Next time we will look at how we can get KPI data from the "database" and do some statistical analysis on them using Python tools! (Hm... this is getting away from the core concept here of making command line tools - we'll finish this console program thing and return to our true path afterwards! Promise!).